ICT Engineering Tools
While in general anything can be used as a tool, there are two types of tools that ICT engineers utilise in solving design problems:
- Hardware tools: measurement tools such as oscilloscopes, multi-meters, and function generators in electronics and digital labs. Media tools such as digital cameras, colour masks, etc.
- Software tools: such as search engines, word processors, image editors, signal analysers, schematic builders and editors, compilers, IDEs (Integrated Development Environment), and tools with which diagrammatical representations are drawn and edited.
Common important, software tools that successful ICT engineers often utilise are listed below:
- Search engines: dealing with design problems involve searching for relevant information. Relevant information can be anything from information about the problem itself, or about similar problems, to present design solutions. Examples of search engines are Google, Yahoo!, and WolframAlpha. WolframAlpha is a search-engine-like website that can be used for obtaining different kinds of information such as facts about materials, lands, planets, sciences, etc. It can also be used for calculating mathematical expressions and conversion of number systems.
- Concept map tools: concept maps are diagrammatical representation of concepts and inter-relationships between them. There are a number of software tools that can draw these maps such as CmapTools and Microsoft Visio. Concept maps are briefly covered in A Problem Solving Mind and Summary.
- Flow chart tools: as its name implies, a flowchart is a visual diagram that captures or defines the flow of the steps that require to go from point A to point B. It is an algorithm that is represented with geometrical shapes. Point A can be an initial state of a problem and point B its final or partial solution. Flowcharts can be drawn with any software that can draw geometrical shapes. Flowcharts are explained below.
- UML tools: UML stands for ‘Unified Modelling Language’. It is a set of diagrams and techniques with which software engineers and developers design complex software. With these diagrams, structure, behaviour, and interaction of complex software systems can be visually drawn and represented. There are several software tools that are especially designed for drawing these diagrams. Examples of such tools are Jude and MS Visio. One or more of these diagrams is explained below.
Flowchart
As mentioned earlier, flowcharts are visual representations of algorithms. An algorithm is a set of procedural steps from an initial stage to a final stage. The initial stage could be a question or a given value. The final stage could be a solution or a desired outcome. Processes in such steps are represented with a rectangle, usually with a verbal label inside it to explain the process. Decisions are represented by a diamond (a rhombus). Arrows are used to indicate the direction of the flow of the steps. Circles or ellipses are used to define the start and end of the flowchart. There are other geometrical shapes of flowcharts such as shapes representing data, display, input/output and such that we will not go through them in here.
As an example, suppose that we wish to illustrate a counter with a flowchart. We will use a variable ‘i’ as the name of our counter and wish to count until we reach a decimal number of 10. It is obvious that a variable must first be defined in order to change its value progressively up to 10 at which we should stop and terminate the counter. In plain English we would say:
- Define a variable: this is a name or identification of the variable
- Initialise the variable: we must know the initial state of the variable otherwise we couldn’t know where to count
- Increase the value of the variable by a desired number
- Check the variable to see if it reached 10, if it has not reached 10 then go back to step 3 and continue to do so until i = 10
- Terminate with i = 10
The steps above can be represented with a flowchart like below:
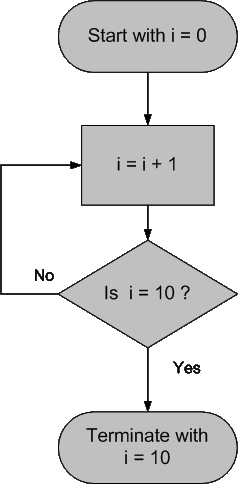 |
| Counting from 0 to 10 using flowcharts |
As it can be easily realised, the flowchart is much simpler and more informative than the plain verbal language. This fact becomes more obvious in a complex system in which verbal representation will simply not be of much help.
return top
Class Diagram
One important diagram of UML is a class diagram. Class diagrams describe the structure of a system in terms of classes. A class is an abstraction of an entity usually with one or more attributes. For example, a ‘Vehicle’ is a general abstraction of wheeled machines that can be used for transportation. Oftentimes, software engineers divide systems into abstract classes for clarity and simplification purposes. A ‘Car’ class can inherit properties from ‘Vehicle’ class. A ‘Vehicle’, then, can be used as a basic blueprint for developing ‘Car’ classes in software world.
Classes are represented with a square. The square is usually divided into two or more sections. At the top section the name of the class is placed. The other sections are used for attributes and, if any, functions of the class, i.e. what the class can do in terms of functionality. Note that first letters of the names of classes are capitalised.
A class, known as a subclass or a child class, can inherit attributes and functions from another class, called parent or base class. An arrow with a solid pointer from the child towards its parent is drawn to indicate this inheritance. The example below shows a basic class diagram.
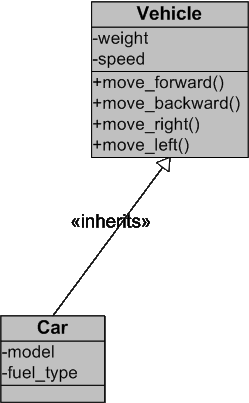 |
| A Vehicle-Car class diagram |
As it is clearly shown in the figure above, the Vehicle class has ‘weight’ and ‘speed’ attributes and four ‘move’ functions. The Car inherits all the properties of Vehicle but it also has its own ‘model’ and ‘fuel type’ attributes as well. Note that the class diagram is built with MS Visio.
return top